
We want to know how much energy we produce when we cycle. We knew our friends from Open Energy Monitor made a system that can read energy and show it in a nice way. So we decided to set up the system.
https://guide.openenergymonitor.org/setup/
Step 1 : The sensors
We want to show the power of the cyclists, so we need to measure voltage and current in a DC circuit (not AC like at home). This is not readily available with Open Energy Monitor (OEM). So we made our sensors.
We needed a current sensor, a voltage sensor and an Arduino to convert the analog signal of the sensor to a digital signal.
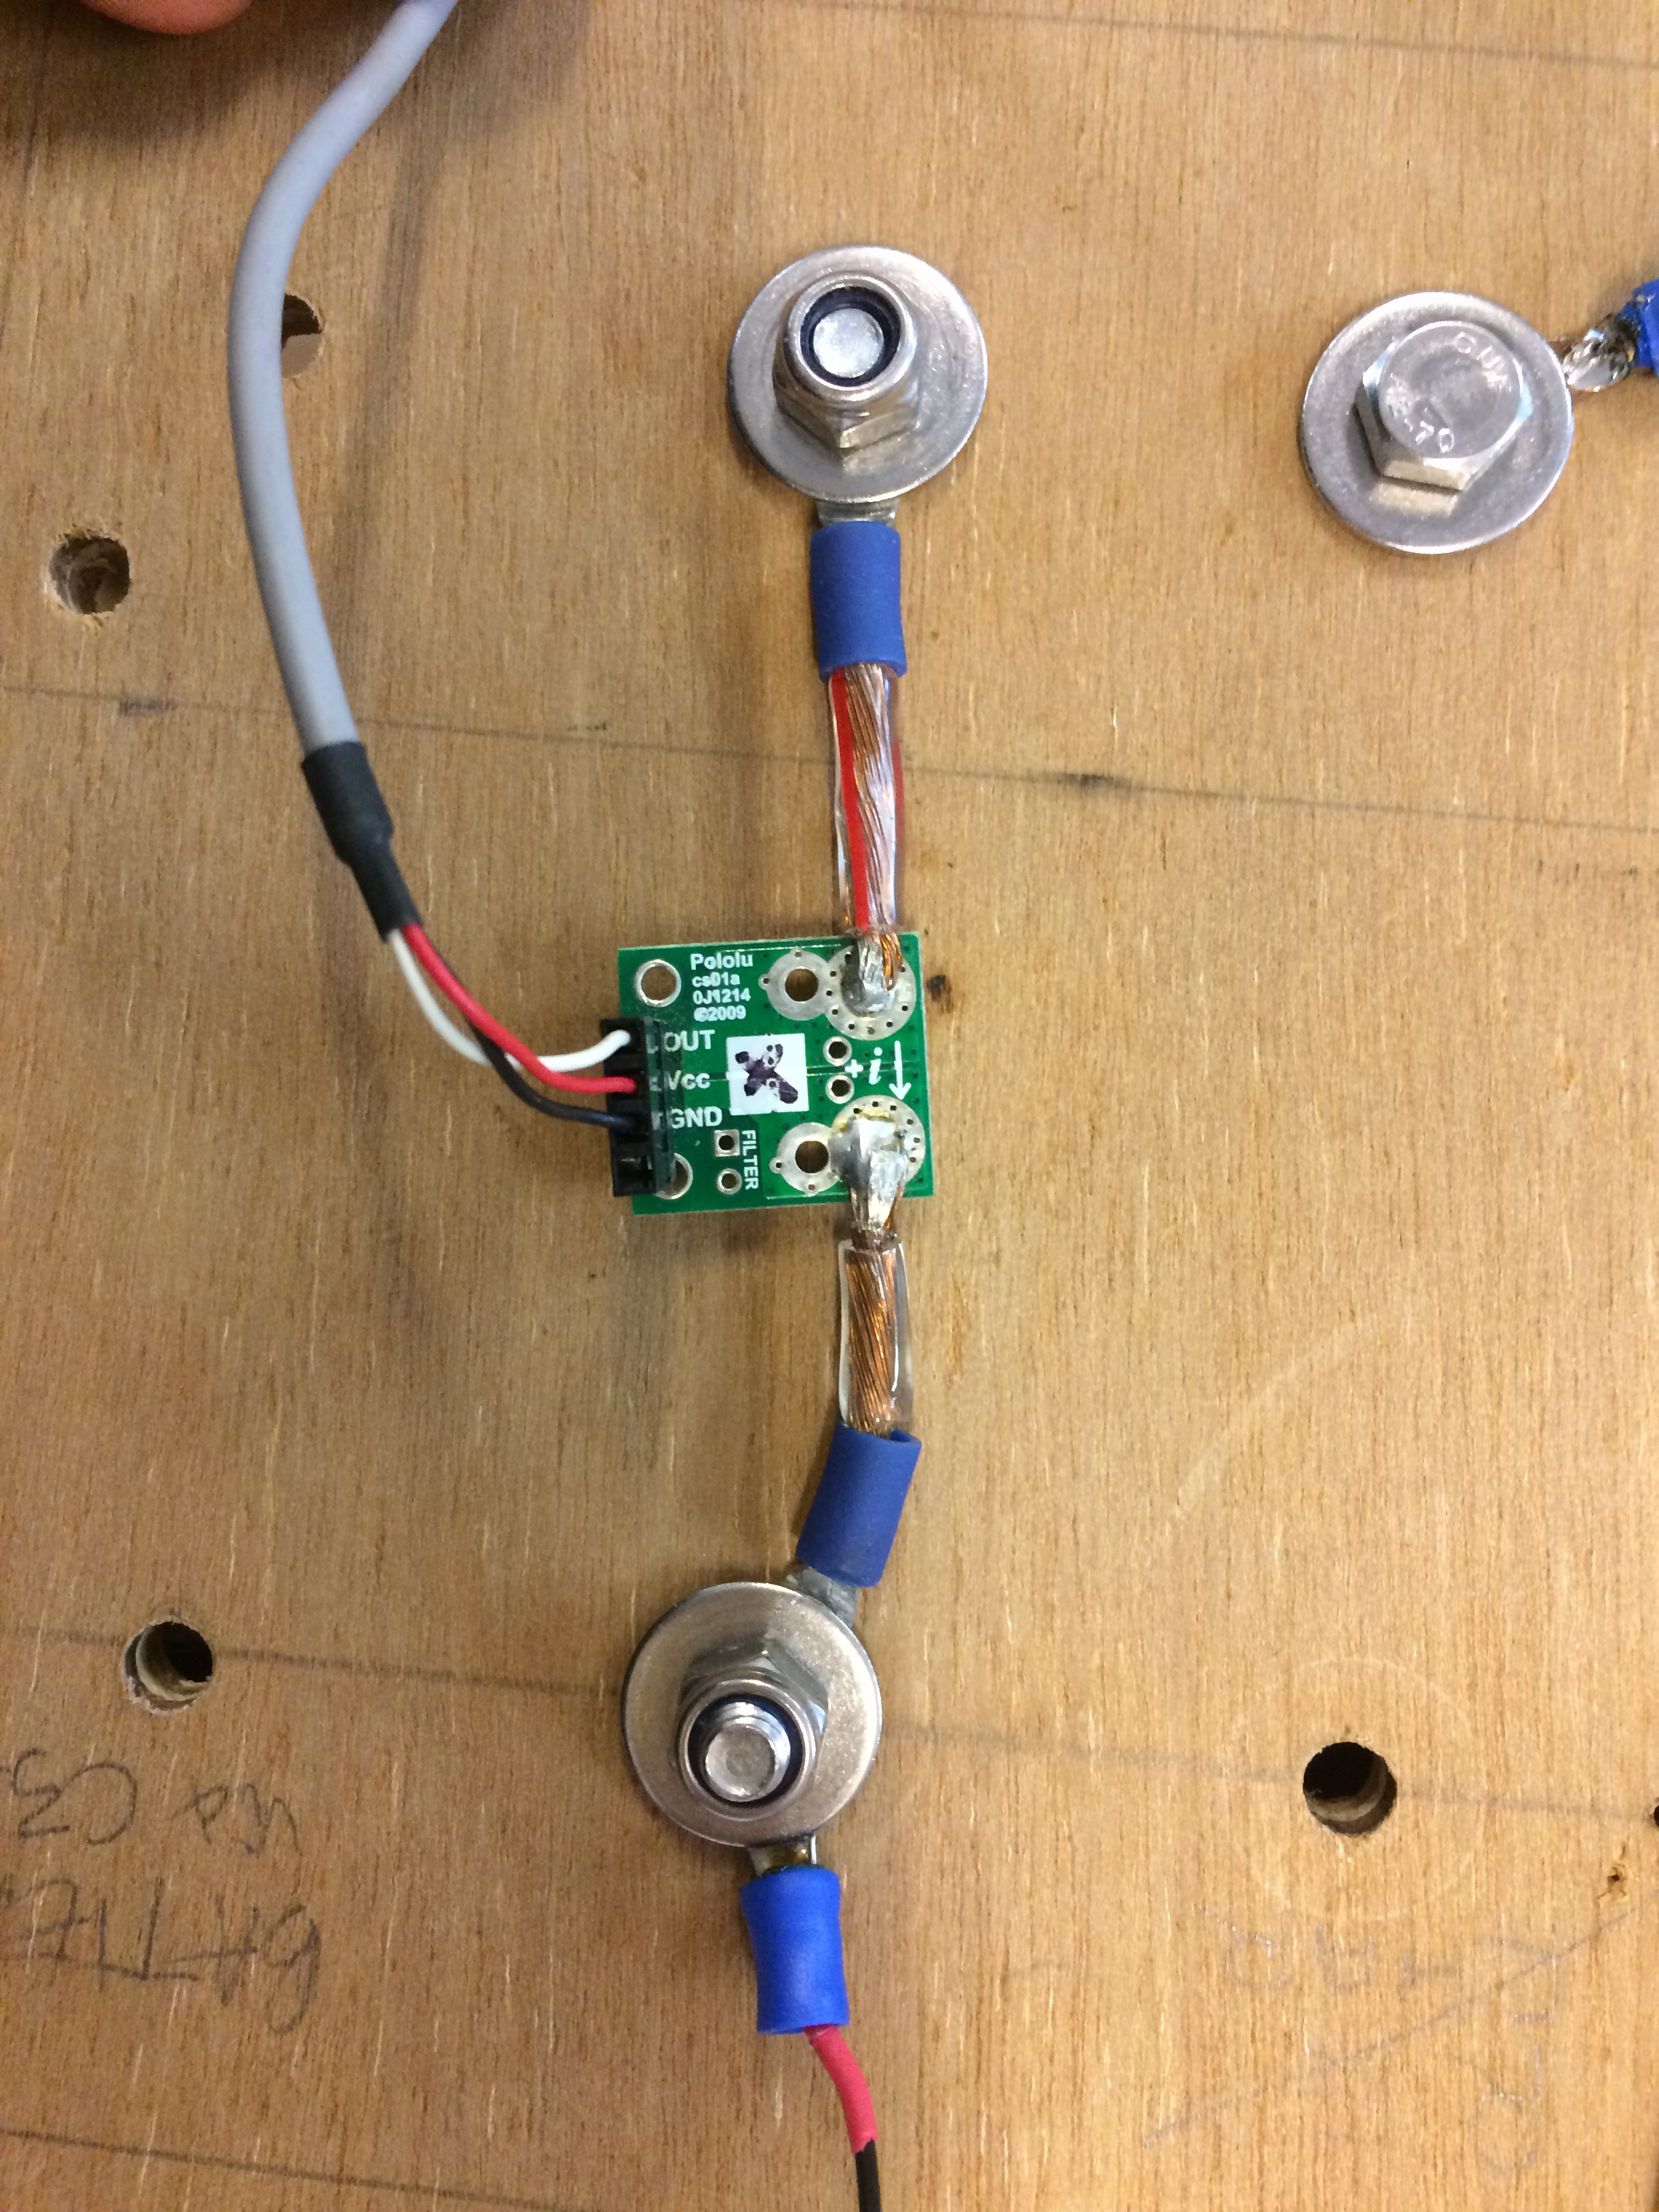
- Current sensor : pololu sensor https://www.pololu.com/category/118/current-sensors
- Voltage sensor : voltage divider https://learn.sparkfun.com/tutorials/voltage-dividers/all
- Arduino : 2 analog inputs, serial output https://www.arduino.cc/en/Tutorial/ReadAnalogVoltage


The tuning of the sensors takes some attention. For the current sensor we measured the mean value at zero current and at 1A with the current source. We used this value to calibrate the sensor output. For the voltage sensor we chose the resistors to transform the highest voltage we expect (48V) to be sure not to go over 5V. In the Arduino code we paid special attention to the division calculations, to not loose significant numbers after the decimal point.
The Arduino needs to send the data in a particular way, we’ll tell more about it later.
Serial.print(nodeID); Serial.print(' ');
Serial.print(a); Serial.print(" ");
Serial.print(b); Serial.print(" ");
Serial.print(c); Serial.println();

delay(1000);
More about this here: https://community.openenergymonitor.org/t/sending-data-from-arduino-to-rasberrypi-using-serial/3822/5
You can find the full Arduino code with comments here : https://www.dropbox.com/s/f00aedttinki786/Arduino%20code%20Open%20Energy%20Monitor.txt?dl=0
Now we can prepare the Raspberry Pi to read the sensors and log the data.
Step 2 : Preparing the logger
We want to log the current, voltage and power on the OEM system. We are using our Raspberry Pi Model B+ and a 16GB SD card with the EmonSD sofstware.
First we prepare the SD card of the Raspberry Pi. Following these instructions: https://github.com/openenergymonitor/emonpi/wiki/emonSD-pre-built-SD-card-Download-&-Change-Log#b-download-image–flash-to-sd-card

Our first SD card was not big enough, so we are working with a 16GB SD card. You can’t just copy the downloaded image, we need the program Etcher to write the SD card.

When working with the command line, it is more easy to connect the Raspberry Pi to a hdmi screen and a keyboard. Login : pi, emonpi2016. Activate ssh communication and type in $ sudo touch /boot/ssh and verify if the ssh file is created with $ cd /boot and $ ls. Expand the data partition to fill the SD card with $ sudo emonSDexpand. Side note, we are not able to connect through ssh, so we keep the screen and keyboard.

Now we connect a wifi dongle to the Raspberry (only the version 3 has a wifi chip integrated). Reboot the Raspberry and then the EmonPi will start emonpi Access Point @192.168.42.1 or emonpi.local. Connect and make a new login. Sidenote, our old iPad is not able to show the content of the web page.
Now we can start reading the data.
Step 3 : Logging the data
The Emoncms system uses the EmonHub to manage the data logging. We first need to configure the Emonhub before we can read the data. The forum gives us an answer : https://community.openenergymonitor.org/t/sending-data-from-arduino-to-rasberrypi-using-serial/3822/19
There are two parts to which we need to pay attention, one is the interface with the Arduino and the other is the decoding of the data. For the interface we define a serial connection :
[[SerialDirect]]
     Type = EmonHubSerialInterfacer
      [[[init_settings]]]
           com_port = /dev/ttyACM0
           com_baud = 9600
      [[[runtimesettings]]]
           pubchannels = ToEmonCMS,
Then we tell how to read the Arduino data. We chose to use node 6 as in the example.
[[6]]
    nodename = energymodule
    [[[rx]]]
       names = current_mA, voltage_mV, current_digital, voltage_digital, power_mW
       datacode = 0
       scales = 0.001,0.001,1,1,0.001
       units =A,V,Adigit,Vdigit,W
Here is the full EmonHub code : https://www.dropbox.com/s/cbavoywbchyx4os/EmonHub%20config%202019.txt?dl=0
We’ll come back later for the EmonCmsOrg settings. Reboot the Emonhub and go to the input tab. You’ll see the inputs that we defined.

Now we can start logging. Configure the input and log to a feed to make it available for visualization. We’re choosing to also log the kWh.

Now we can make an app or a dashboard to view the data. We are now working on the issue of the power feed that is not showing on the graphs.

Now the fun part starts, connect your phone to the EmonPi wifi network, log in at emonpi.local and show the energy production live !
